2025 4th Quarter Market Commentary
Top Headline for Q4: Precious Metals … Wow!
Precious metals stole the show in 2025 – rising steadily all year with a parabolic surge in Q4. Large budget deficits across developed nations finally appear to be driving performance in various inflation hedges. Below is a chart showing the four main precious metals held for investment purposes: gold, silver, platinum and palladium. All rose over 50% in 2025, with Silver (Ticker: SIVR) leading the way at +145%.
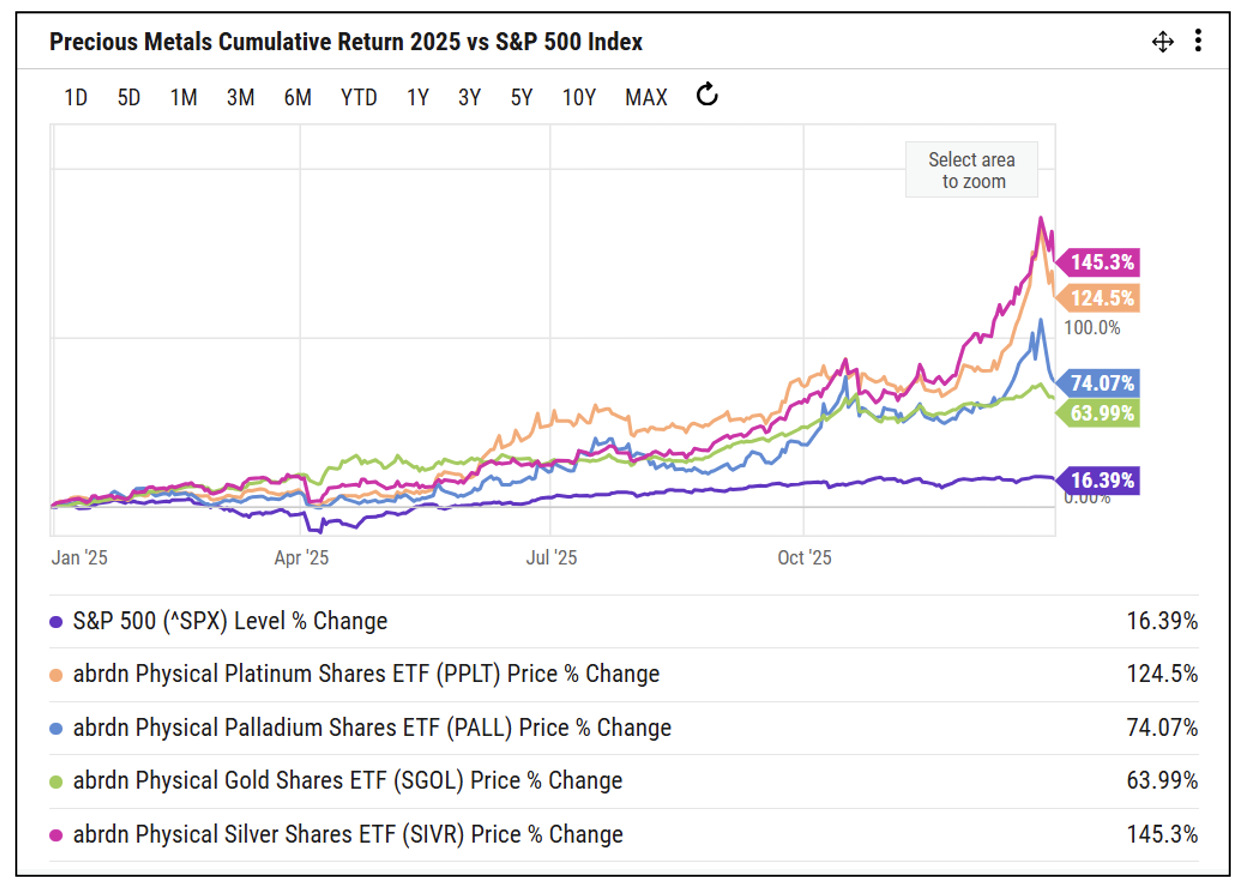
Precious Metals 2025 Performance
While it appeared to be “business as usual” for the U.S equity market in 2025, with the S&P 500 Index up 16.39%, several potential near-term warning signs have emerged beneath the surface. Although the S&P 500 Index ended the year within 2% of its all-time high, many mega-cap technology companies remained significantly farther from their peaks after a sharp Q4 drawdown (see table below).
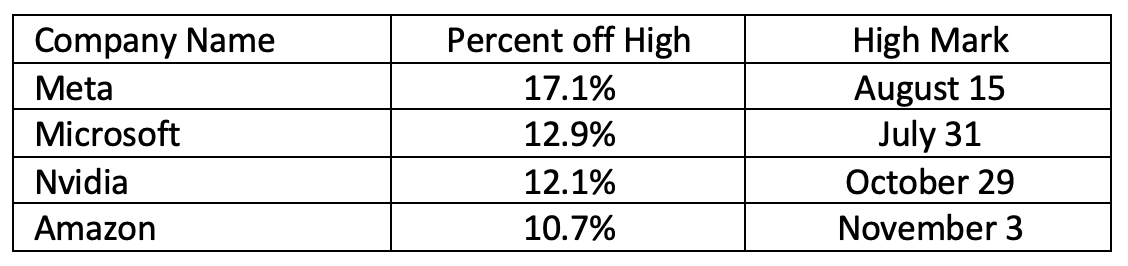
Mega cap technology companies percent from their high as of 12/31/25.
Our observation is that other sectors have been closing the performance gap, while Technology has been showing signs of exhaustion. Looking ahead, this doesn’t necessarily mean we don’t want to have exposure to Technology, but we see the potential for downside volatility sometime in the first half of 2026 and would view any meaningful weakness as a buying opportunity.
General Market Update
US Equities: The S&P 500 Index rose 2.65% during the quarter while the equal-weighted S&P 500 Index (Ticker: RSP) was up 1.38%. The tech-heavy Nasdaq Composite advanced 2.72% and the Russell 2000 small cap index was up 2.19%. The quarter highlighted Technology’s outsized influence on cap-weighted indices. From October 29 through November 21, the cap-weighted S&P 500 Index had a -5.8% drawdown – largely driven by the Technology sector (Ticker: XLK) which was down -12.6%. In contrast, the equal-weighted S&P 500 (Ticker: RSP) held up better, falling only 3.8% over the same period.
International and Emerging Market Equities: Continued uncertainty around the U.S. dollar and monetary policy appears to be driving some investment dollars toward developed international equity markets. For example, the Schwab International Equity ETF (SCHF) was up 6.2% for the quarter, while the Schwab Emerging Markets ETF (SCHE) was up 0.9%. Notably, both indices comfortably outperformed all major U.S. indices in 2025 with SCHF up 34.5% and SCHE up 26.6%. As previously mentioned, it appears to be a goal of the current U.S. administration to lower the value of the U.S. dollar as part of an effort to improve the U.S. trade deficit. Any ongoing policy movements in this direction would likely continue to push some investment dollars into international markets.
Fixed Income and Credit: The big news in the credit markets is the continued reduction in the Federal Funds Rate (“FFR”) by the U.S. Federal Reserve Bank (the “Fed”). As of December 31, 2025, the FFR target range sits at 3.5-3.75% - down roughly 200 basis points from its late 2024 peak. Despite the drop in short-term rates, the “long end” of the yield curve has not moved much with the 10-year U.S. Treasury yield hovering between 4-5% all year. It was particularly stable in Q4 - trading in a tight range of 4.0-4.2%. As the yield curve remains relatively flat, we continue to see value in medium duration credits while taking some longer duration exposure purely as a recession hedge.
Pro-Inflation Investments: Until governments meaningfully rein in spending, it will be important to continue to find ways to protect “purchasing power” (i.e., what your portfolio can buy on an inflation-adjusted basis). Despite the recent surge, we continue to like exposure to precious metals. Client portfolios will continue to maintain a position in Gold and we would use any volatility as a chance to add exposure. The SPDR ETF for gold (Ticker: GLD) was +11.5% during the quarter and +63.7% for the year.
A Look Ahead
We enter 2026 alert for increased market volatility. As noted, the Magnificent 7 stocks and the broader Technology sector, representing roughly one-third of the S&P 500’s market capitalization, have shown widespread weakness. Market breadth (the percentage of stocks advancing with the overall market) has also deteriorated significantly in recent months.
Any period of consolidation in the Technology sector will likely lead to outperformance of other “neglected” sectors of the market. In fact, we may already be starting to see some signs of rotation into non-Tech sectors. For example, Healthcare (Ticker: XLV) was up 11.7% in Q4 compared to just 2.3% for Technology (Ticker: XLK). We are keeping an eye on asset classes and sectors of the market that have lagged recently as areas to potentially “catch up” to Technology. As a result, clients may see rebalancing and a shift in sector exposures to take advantage of any market volatility.
Several 2026 events could heighten investor uncertainty, including a possible Supreme Court ruling on tariff policy, stubbornly high or re-accelerating inflation, a leadership transition at the Federal Reserve, and the November midterm elections. Historically, midterm election years are the weakest in the four-year presidential cycle. We therefore expect volatility but are well-prepared to navigate it.
Best wishes for a prosperous 2026!